
🎯 For administrators. You may have access to this feature depending on your package, region, and industry. For Point of Sale integrations supported in Planday for AU.
You can effectively track and record revenue for your business in Planday. This article will show you how to add your revenue to Planday, track daily labour costs, and enter a forecast to track and compare your sales targets.
To configure revenue and budget and Planday, follow the steps below:
Create Revenue units
A Revenue unit is a cost center that holds revenue. You can create multiple units for each department in Planday to keep separate data and reporting info. You need to have at least one revenue unit for this feature to work.
To create revenue units, go to Reports > Revenue > Manage revenue.
⬆️ Then, click on Create unit. In the edit window, you can configure the following settings:
Name - Provide an appropriate name for the unit
Department - Choose the department in which you want to create the unit.
Allow employee purchases - This field is typically unchecked.
Enter daily revenue - Ensure this box is checked to allow the entry of your daily revenue (which represents your sales forecast).
Include in total revenue - This box is selected by default. If unchecked, the revenue generated by this unit will not be included in the total revenue.
Unit sort order - The area with the lowest number is displayed first. You are free to use this field or not.
Description - Optionally, you can enter a description.
After configuring these settings, confirm your choices by clicking Save.
Enter your daily sales forecast
⬆️ To be able to assess your labour costs in relation to your revenue, you can enter a daily sales forecast (=daily revenue). To do so, follow these steps:
Navigate to the menu Reports > Revenue > Manage revenue > Daily revenue
Select the desired day from the date selector.
Insert the daily revenue (or daily sales forecast).
Optionally, you can include a Cash difference or a Note as a comment.
You can also specify a fixed monetary additional payroll cost per day, which will affect the payroll percentage in the schedule and in the Revenue overview, for both weekly and monthly periods.
Click Save when you're done
As the week goes by, you’ll update the daily revenue (or daily sales forecast) field manually to reflect the actual revenue. Go to Enter and update daily sales during the week to find out how to do this.
Note: If you’re using a Point of Sale (POS) integration, daily revenue will automatically be imported into Planday. In that case, revenue imported via a POS system will overwrite the daily revenue you entered manually. Your forecast daily revenue won't be retained if an actual value is entered or synced with an integration.
Set weekly or monthly budgets
With the basics of revenue in place, you can go to the tab called Budgets (1.) under Reports > Revenue > Manage revenue. Here, you can configure weekly or monthly budgets for both revenue and payroll percentage.
If you’ve enabled department-specific budgets within the advanced settings, you’ll have the option to enter the budget and payroll percentage forecasts for each of your department, depending on your operational goals.
Entering these forecasts allows you to compare your actual values with those in the overview (add link to other section in this guide Get an overview of your payroll costs vs revenue).
⬆️ Ensure that you select the correct department, the right budget interval (weeks or months) and the right date range, (2.) then click on the Edit values button (3.) on the right.
The following example is for the budget per week option.
1️⃣ Revenue forecast: Enter here your expected revenue (in your Planday account's local currency) per calendar week
2️⃣ Payroll % target (week): You can specify here how high your pay percentage (in %) should be per week.
3️⃣ You can also enter a payroll % target distributed per day of the week. In the schedule, the payroll percentage target that you entered for each day will be displayed under the respective days.
4️⃣ By clicking the Copy icon, you can replicate these values to all fields (Revenue forecast and the weekly and daily payroll %) in the rows below. You can change the data in each field later, if needed.
Optionally, you can also enter any Payroll costs not on the Schedule
Additionally, you can add a Note
Confirm your settings by clicking Save.
Note: While you can set a monthly budget, it won't be displayed on the schedule.
Set advanced revenue settings
Planday offers a variety of options, such as including or excluding GST, the consideration of open shifts costs, additional payroll costs, etc. These choices aim to provide you with a more accurate understanding of your labor expenses in relation to your revenue forecasts.
Set additional payroll costs
Set additional payroll costs
You can use this option to give you a more realistic view of your labour costs when scheduling. To learn more about additional payroll costs, you can read How to show additional payroll costs on the schedule.
Display the cost of Open shifts on the schedule
Display the cost of Open shifts on the schedule
Choose this option if you wish to display the cost of open shifts on your schedule so that it compares against your budget.
You can set this cost under Settings > Reports > Revenue > Open shifts.
Note: Planday calculates the cost of Open shifts based on the Employee group's default wage. If the Employee group doesn't have a default wage, Planday will then consider the shift's Department Hourly wage you enter manually on the page.
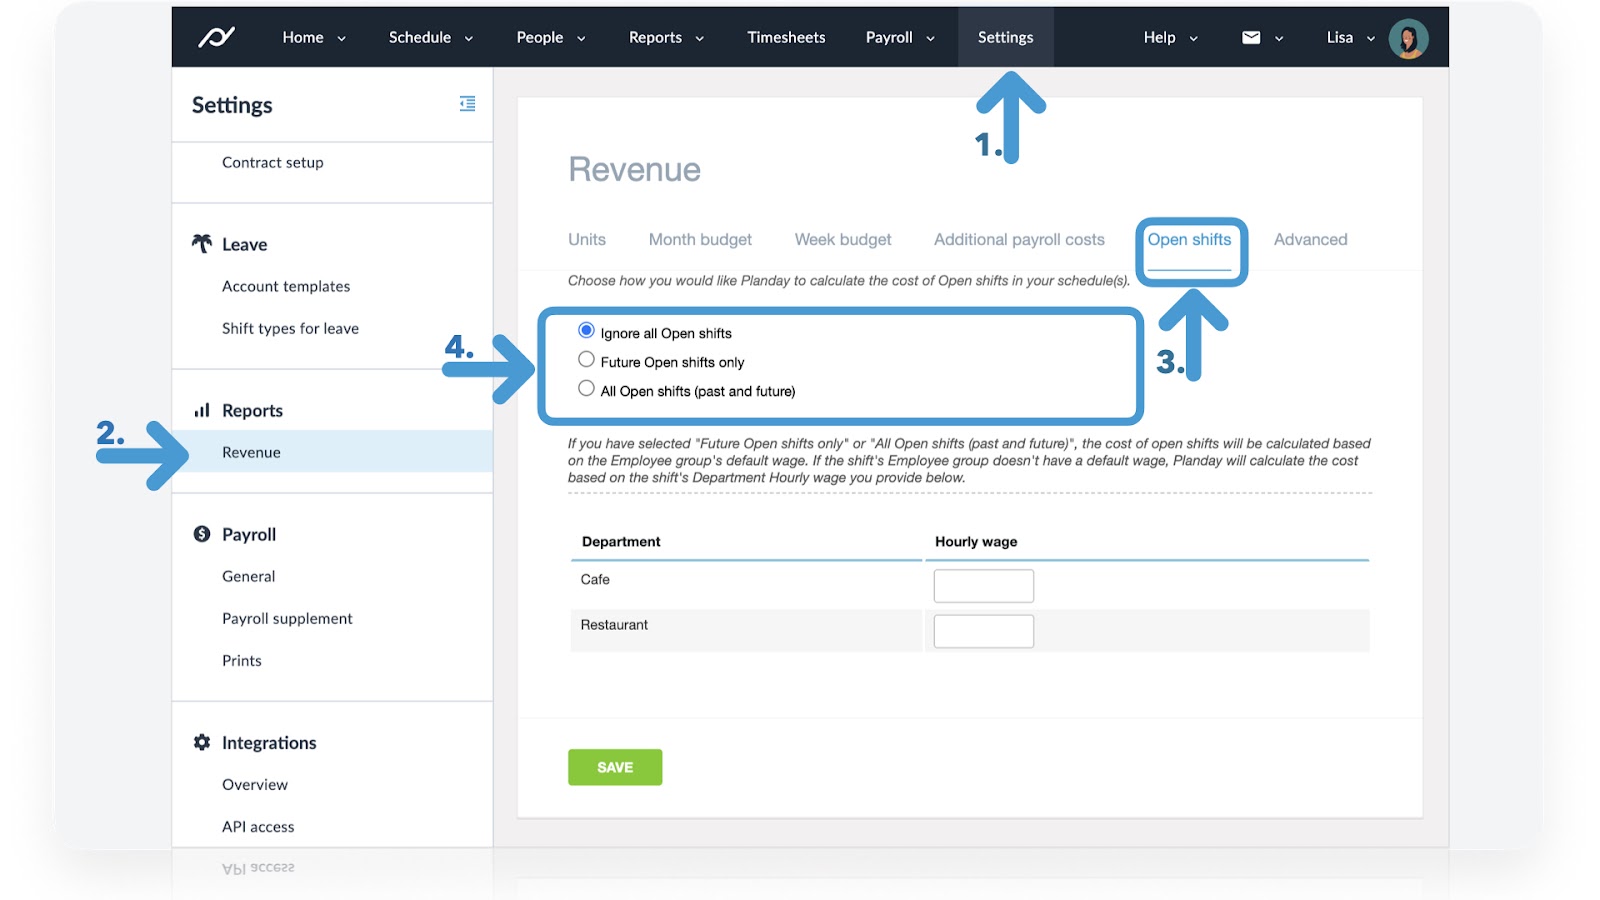
⬆️ You have several options to choose from (4.):
Ignore all Open shifts: Open shifts will not have a cost on the Schedule
Future Open shifts only: Planday uses the Employee group's default wage.
All open shifts past and future: Planday uses the default wage of the employee group for all open shifts.
More advanced revenue settings
More advanced revenue settings
In the Advanced tab under Settings > Reports > Revenue > Advanced, you can find several options.
These settings offer various possibilities for displaying and calculating revenue in Planday. You can enable department-specific budgets, choose to display or hide scheduled salary percentages in comparison to the budget, determine whether revenue should exclude sales tax, and set the tax rate as a percentage.
Note: Enabling department-specific budgets allows you to choose a department when viewing revenue reports under Reports > Revenue from a daily, weekly or monthly perspective.
View your revenue figures on the Schedule
⬆️ To do this, navigate to the Schedule and click on View settings. In the editing window that appears, activate the Revenue option. This action will add a new bar at the bottom of the screen, displaying the following information for each day. ⬇️
Click on this arrow to see what each of those options represents
Click on this arrow to see what each of those options represents
1️⃣ Hours / Payroll: This represents the total working hours (excluding breaks) for all shifts in the week and the total payroll costs for that week.
Note: To display payroll costs, you need to enable the "Payroll Hours & Costs" slider under View settings.
If you have salaried employees, their salary costs will be added here, depending on your allocation settings. Read more in the How to display the payroll costs of salaried employees in the schedule.
2️⃣ Revenue: You can see a revenue value below each calendar day. This can be a forecasted or actual value. Click on it to change the value, e.g. from a forecast to your actual revenue of that day. The total weekly value is displayed on the side.
Payroll percentage for each day: The displayed percentage indicates the share of labour cost for that day. In brackets, you can see a target value, which you defined in the budget. If the value is red 3️⃣, you are above the target value. If the value is green 4️⃣, you are below it or exactly on target.
On the left side of the revenue bar, you will see a summary of the values for the whole week. Additionally, the following calculations are made for the proportion of salary costs:
5️⃣ Target: This represents your expected payroll percentage for the week, as entered when setting up the budget.
6️⃣ Actual: The payroll percentage is calculated based on the total payroll costs for the week and the daily revenue you have entered.
7️⃣ Forecast: This is the payroll percentage, calculated based on the total payroll costs and on your sales forecast for the week, as defined during the budget setup (link to other part of this guide Set weekly or monthly budgets).
Enter and update daily sales during the week directly from the schedule
⬆️ You can enter your daily revenue in the schedule by clicking on the revenue value under each day on the schedule.
The Daily Revenue edit window will appear (as shown in the image above).
If the date is in the future, you can enter your expected revenue (in local currency) as a forecast here.
If the date is in the past and you have revenue data available, you can enter your actual revenue.
As the week goes by, you will need to update your schedule by entering the actual sales into the daily revenue tab. Doing so will either increase or decrease your actual labour percentage as the week unfolds, allowing you to make more informed decisions regarding staffing hours or increasing sales in order to hit your targeted labour budget.
Alternatively, you can enter and update these sales under Reports > Revenue > Manage revenue > Daily revenue.
Note: You can also import revenue figures into Planday automatically via a Point of Sale (POS) integration. In that case, revenue imported via a POS system will overwrite the daily revenue you entered manually.
Get an overview of your payroll costs vs revenue
If you’re doing payroll costs versus revenue forecasting, you can get a clear and dynamic overview. This allows you to review payroll costs on a daily, weekly or monthly basis and align them with your revenue figures.
To access this overview, go to Reports > Revenue. Here, you can configure various filters (1.):
Choose the Department(s) for which you want to see the figures
View data by: Choose days, weeks or months
If you choose weeks or months, you’ll have the option to view data for up to 10 weeks or up to 3 months
Specify the Date range for the figures you wish to see
Based on these filters, you’ll have some revenue data (2.):
Revenue: this represents the total of your daily revenue for the selected period
Days over budget: Planday will highlight the number of days when you exceed the budget
Payroll % based on revenue: this value corresponds to the payroll cost share calculated based on the total payroll costs and the total daily revenue for the chosen period
Payroll % based on revenue forecast: the value corresponds to the payroll cost share calculated based on the total payroll costs and your sales forecast for the chosen period.
Further down, under Details, you’ll be able to see a breakdown of this revenue data for each day, week or month within the chosen period (3.).
See your revenue on the home dashboard
See your revenue on the home dashboard
Activate the revenue widget on the Planday dashboard to see current revenue data on your homepage.
Click Configure to select the department and the period for which you want to display revenue.
If you manage multiple departments, you can also compare the revenue figures among them.
See related articles:
ℹ️ Need more help?
🔍 Search the Help Center | See videos at Tutorials.Planday.com
💬 For personalised support
Log in and contact support using the blue icon at the bottom for further questions.